First run of Canarytrace
What you’ll learn#
- You will know how to run Canarytrace Smoke
- You will know what data it collects
- You will be know how to prepare the environment for data storage and visualization
- You get a dashboards with visualizations
Welcome to Canarytrace#
This tutorial introduces you to the essentials of Canarytrace community edition by walking you through run first smoke on your localhost.
Canarytrace is a Plug’n'Play stack for testing, monitoring availability and measuring the loading speed your web application from user perspective. The canarytrace design is designed to be easy to run and maintenance-free. So you only need 5 minutes 👌
Prerequisites#
Only Docker. If you don't know the docker, take a look at our examples.
- Contact us to obtain a Canarytrace Docker image and your license
- How to run Canarytrace on Windows 10 Pro
- How to run Canarytrace on Linux
Step-by-step#
We will go step by step to start testing successfully.
Run Elasticsearch in a Docker#
Data from Canarytrace are continuously stored to Elasticsearch.
Create a user-defined bridges
- Elasticsearch is the distributed search and analytics engine at the heart of the Elastic Stack.
Run Kibana in a Docker#
Kibana is a web application with GUI for viewing data stored in Elasticsearch.
Open localhost:5601 in your browser and wait for Kibana will be ready.
Setup Elasticsearch and Kibana#
- Canarytrace Installer prepare Elasticsearch and Kibana for Canarytrace use.
Prepare script for run Canarytrace Smoke#
For this demo we use docker-compose. Create file with name docker-compose.yaml with code:
Run Canarytrace smoke with two URLs.#
In this same location where is your docker-compose.yaml run docker compose
and result is
If you have problem with docker-compose look at the bugs #44, #45 from the community
What data is stored into Elasticsearch#
Canarytrace collect these data
c.report-*index with test step name and function resultpassed / falsec.performance-entries-*index with collected list of all PerformanceEntry objects for the tested page.c.smoke-title-*index withentryURL,responseUrl,title,responseStatusandresponseStatusTextc.audit-*index with metrics from performance audit.
View the result in Kibana#
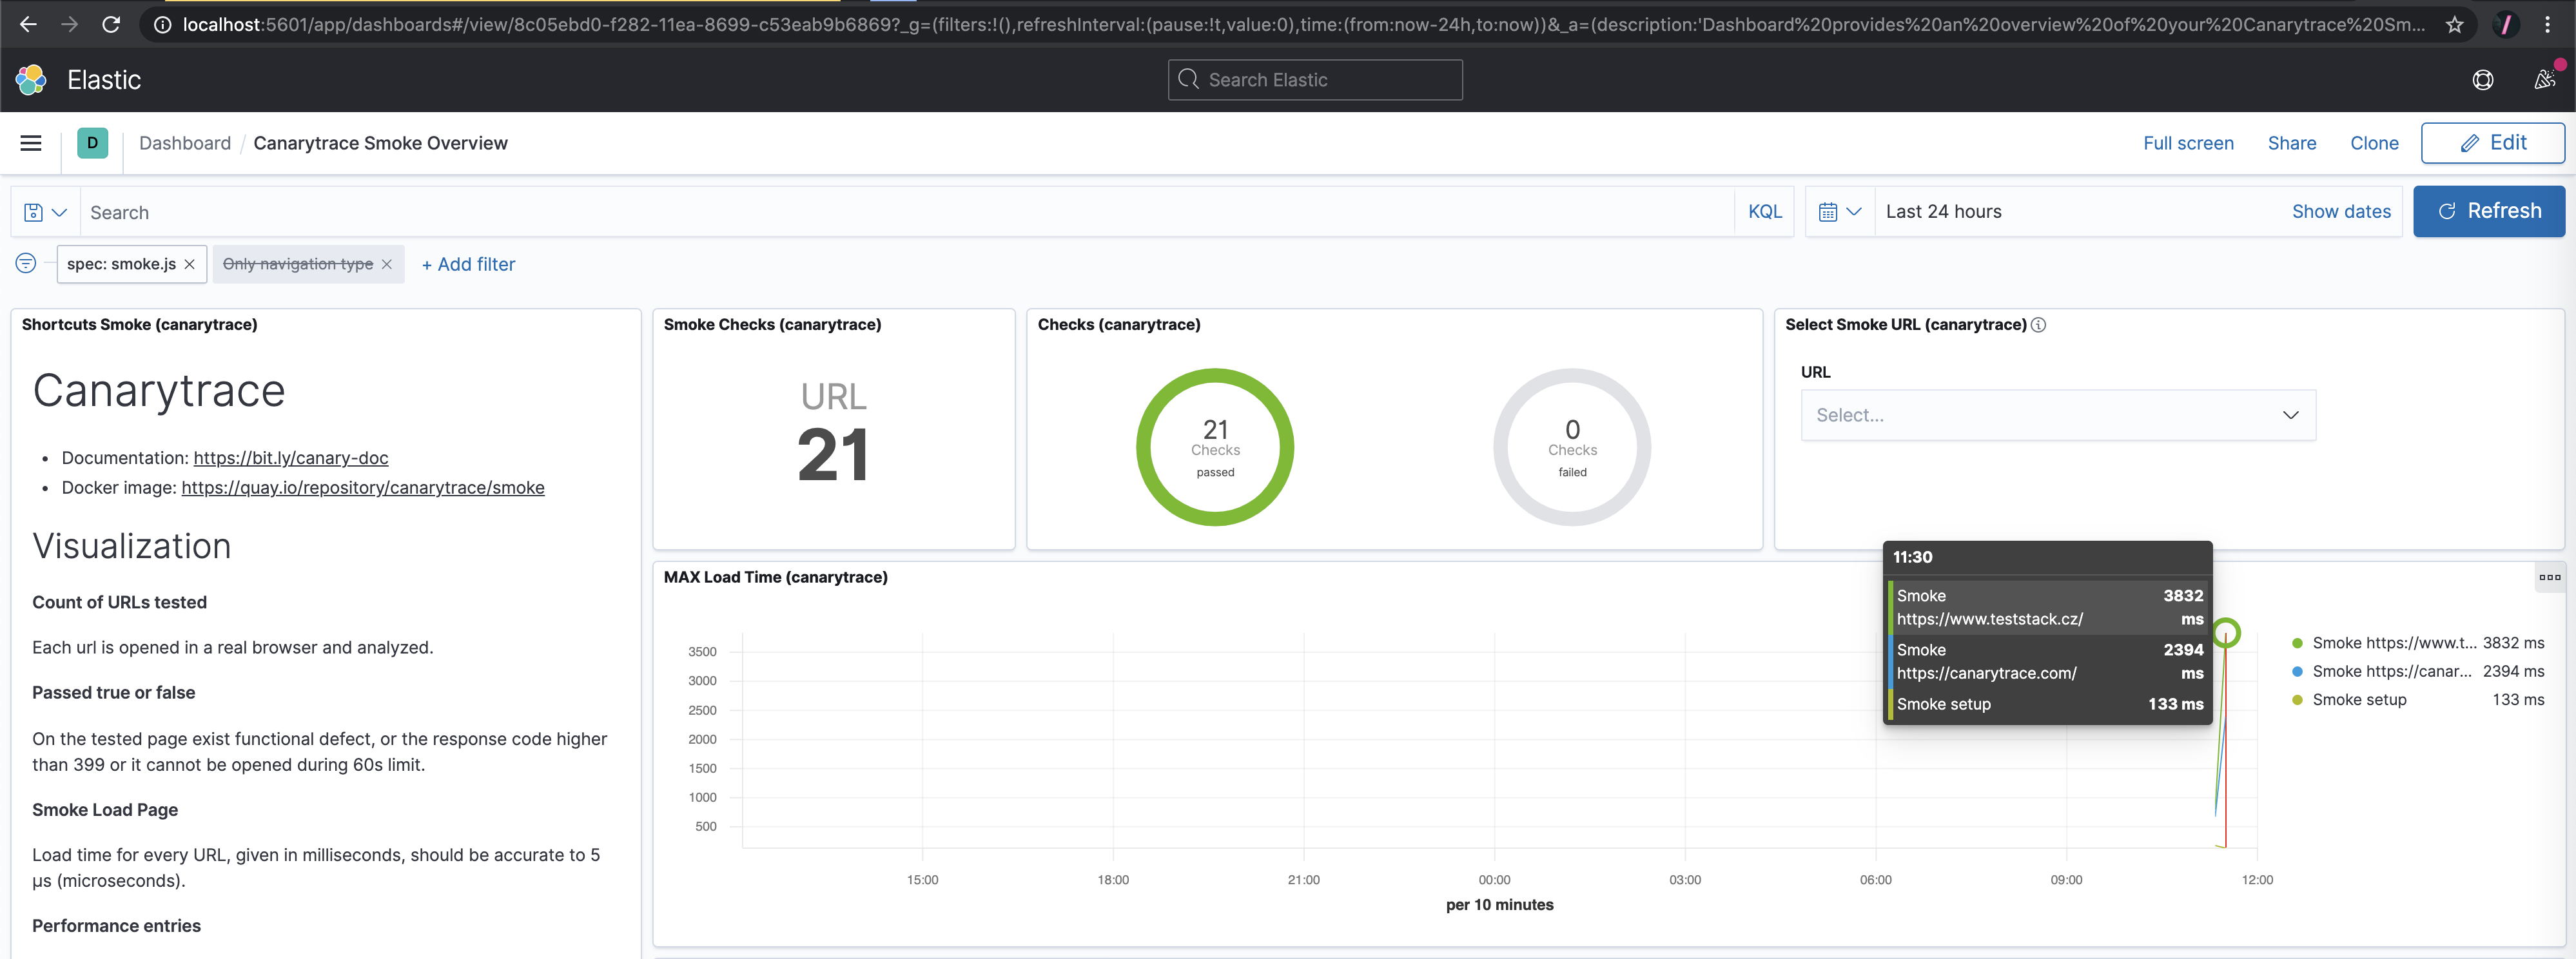
That's all 🎉 Now you can explore dashboard and visualizations in Kibana. Open http://localhost:5601/ in your browser and navigate to Dashboard / Canarytrace Smoke Overview

For real use or for production use start your Canarytrace on cloud in Kubernetes.
- Do you find mistake or have any questions? Please create issue, thanks 👍
- Have more questions? Contact us.