Elasticsearch and Kibana
What you’ll learn#
- What is Elasticsearch and Kibana
- Why we use Elasticsearch
- How to install Elasticsearch and Kibana via Docker
What is Elasticsearch?#
Elasticsearch is the distributed search and analytics engine at the heart of the Elastic Stack. In Elasticsearch is stored all data collected from Canarytrace and browser API's.
Elasticsearch is completely control via REST API and thanks to is possible work with data via other tools. So, Canarytrace store all raw data to Elasticsearch.
In our Canarytrace stack is Elasticsearch one of the most important parts. Elaticsearch allows data filtering, searching and aggregating.
What is Kibana?#
Kibana is a free and open user interface that lets you visualize your Elasticsearch data and navigate the Elastic Stack.
In Canarytrace ecosystem is Kibana a window into results of measure and interface for invetigate of incidents and view of agregated data to graphs.
Kibana use data from Elasticsearch for generate graphs and visualizations. Your data is diplayed in visualizations and visualize is are arranged in dashboards.
The dashborads can be more, but every dashboards shows data / graphs for different type of data.
How to run#
Elasticsearch and Kibana is possible install via Docker or use Elasticsearch cloud.
Elasticsearch#
Create a user-defined bridges
Run dockerized Elasticsearch
--net canarytrace is user-defined bridges for all Canarytrace components
Wait 1 minute and check docker logs -f elasticsearch, that Elasticsearch is ready to use. The log doesn't contains no error messages.
Or you can call REST-API of Elaticsearch, just only open this URL http://your-ip:9200 in your browser and result is
- More info in Elasticsearch dokumentaci https://www.elastic.co/guide/en/elasticsearch/reference/current/docker.html
Kibana#
Wait 1 minute and check docker logs -f kibana, that Kibana is ready to use. The log doesn't contains no error messages.
Always use the same version of Kibana such as version of Elasticsearch.
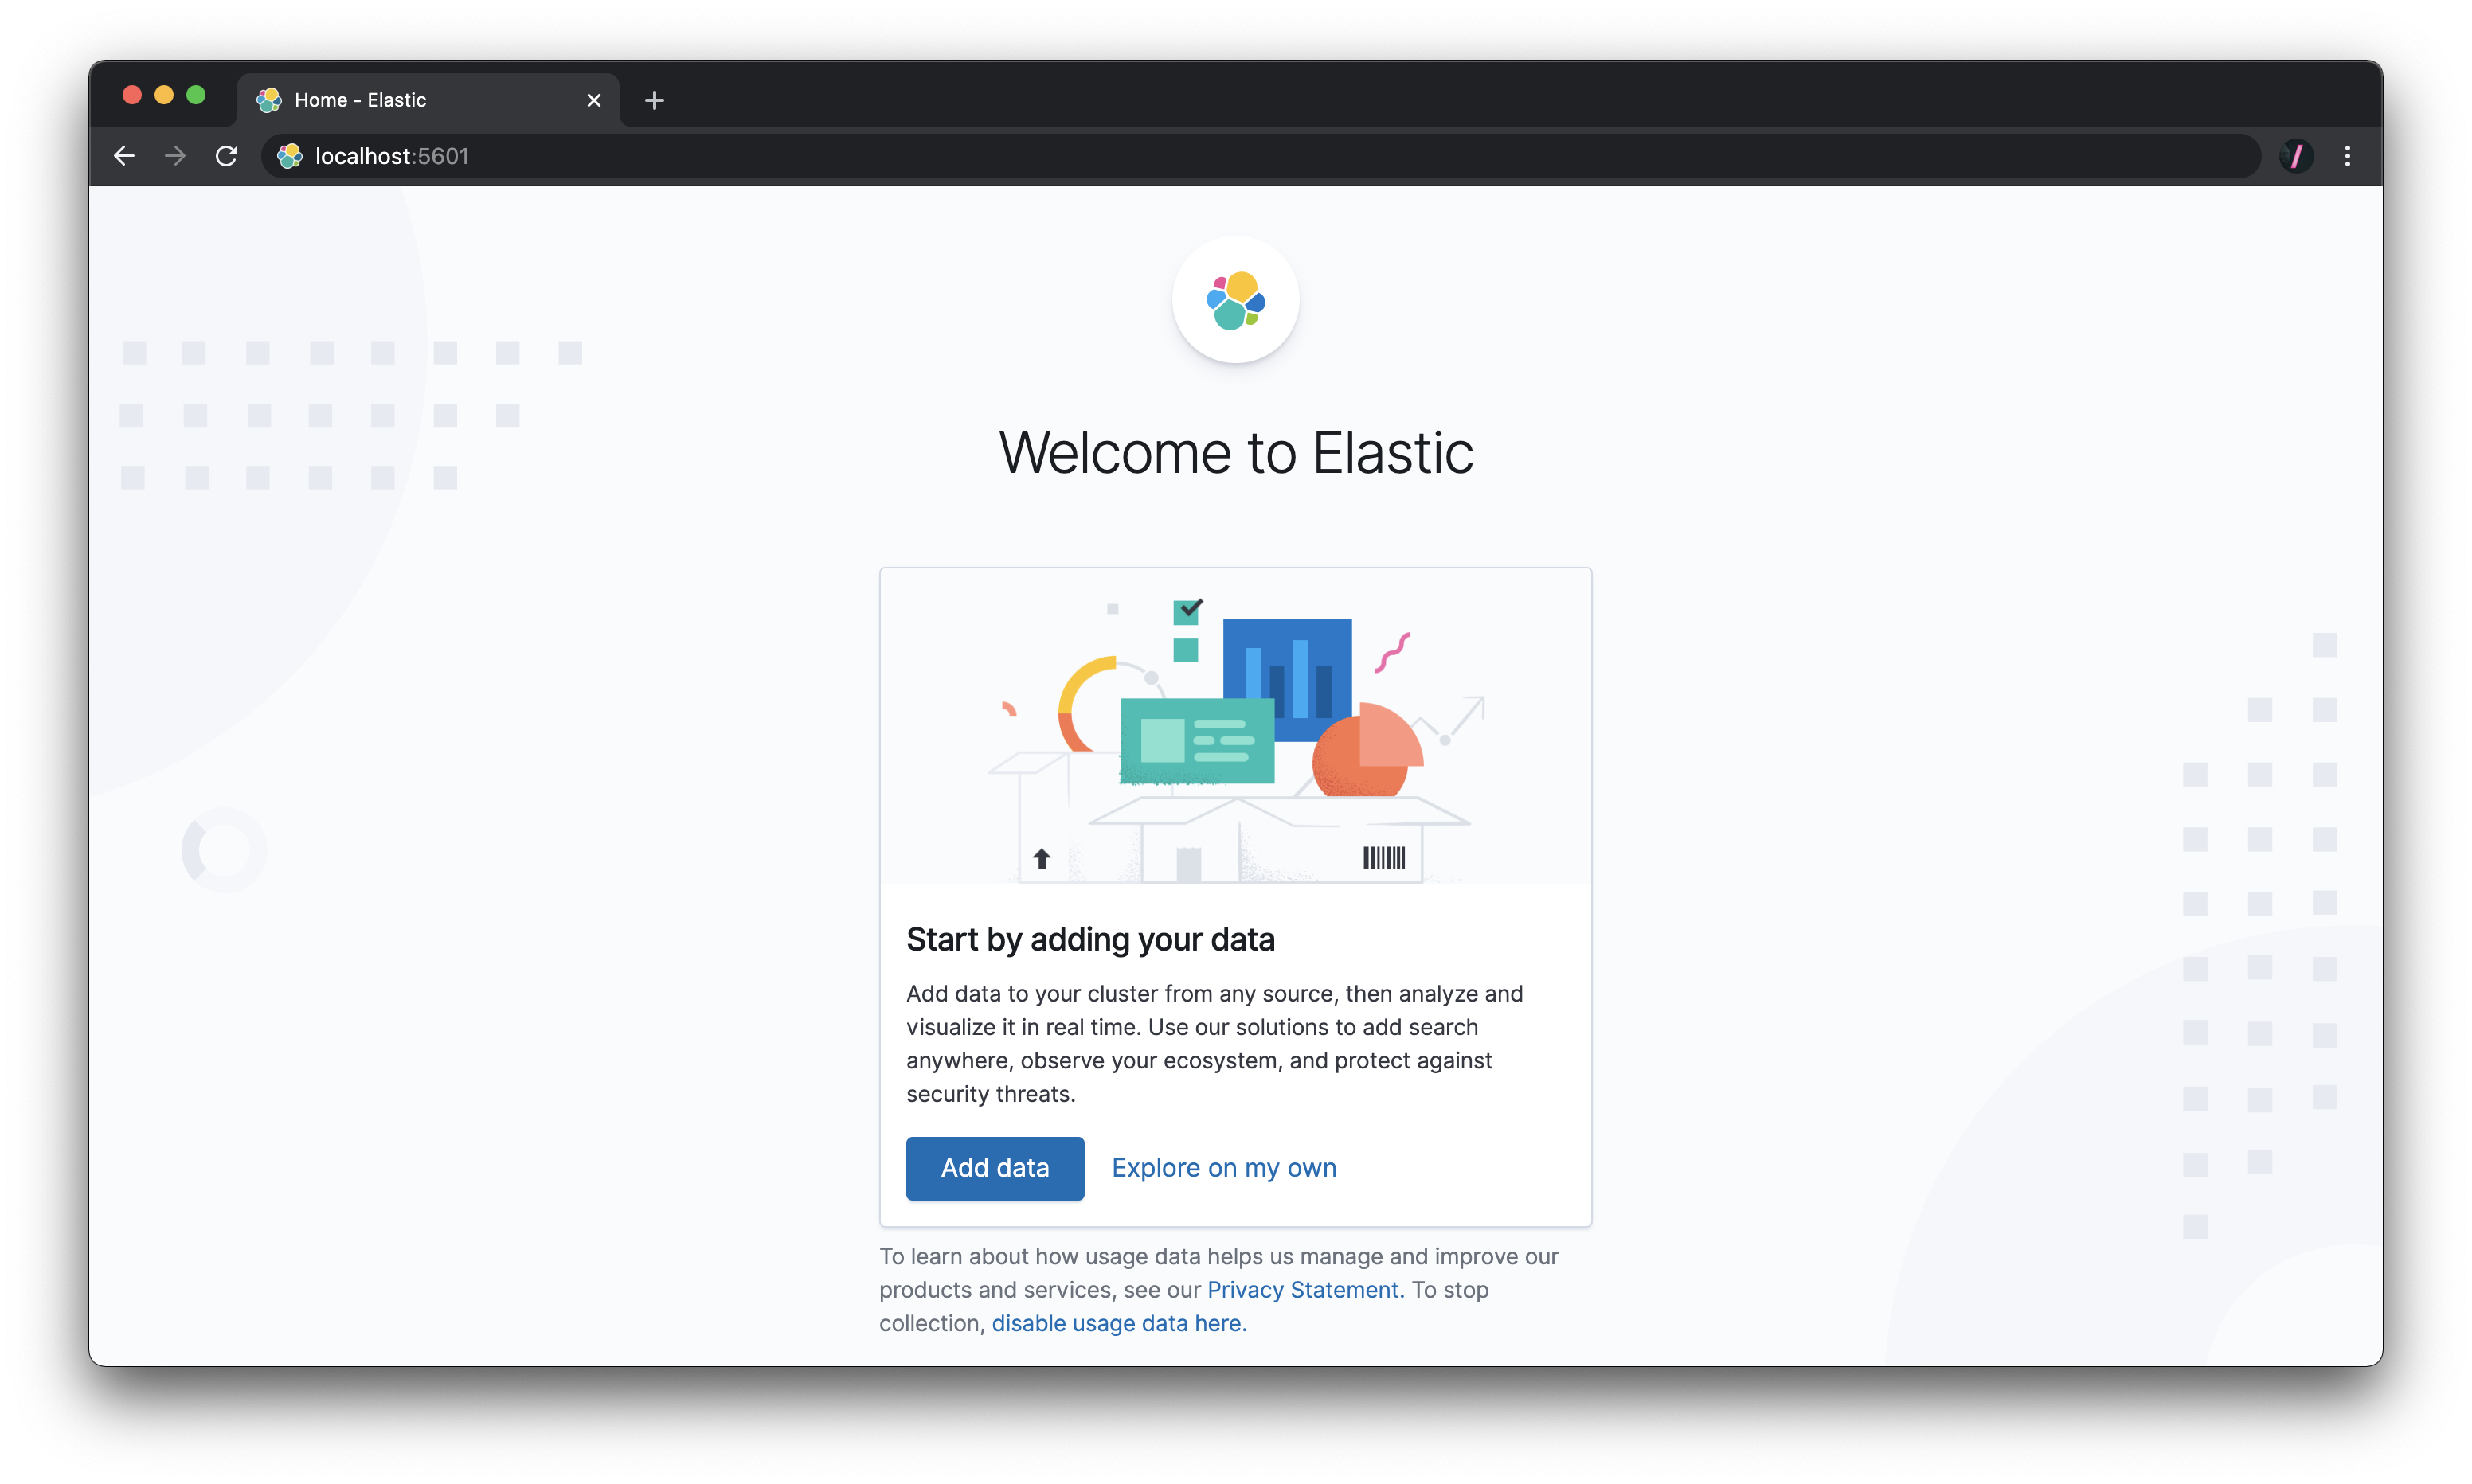
Next open http://localhost:5601 in your a browser.
How to setup Elasticsearch stack?#
Elasticsearch and Kibana are after first run completely empty. Before first run of Canarytrace needs setup:
- Setup Elasticsearch and Kibana
- Import Kibana visualize and dashboards
We have dockerized Canarytrace Installer, which sets up Elasticsearch and Kibana in some of seconds.
- Do you find mistake or have any questions? Please create issue, thanks 👍
- Have more questions? Contact us.